Data Migration
Maximizing Data Utility with Customizable Dashboards
Maximize data utility with customizable dashboards. Tailor insights, integrate diverse data sources, and ensure real-time updates for informed decision-making.
Jun 25, 2024

In today's data-driven business landscape, maximizing data utility is crucial for informed decision-making and strategic planning. Customizable dashboards offer a powerful solution by providing businesses with the flexibility to tailor data visualization to their unique needs. These dynamic tools enable organizations to integrate diverse data sources, track key performance indicators (KPIs), and generate real-time insights. By leveraging customizable dashboards, companies can enhance their operational efficiency, identify emerging trends, and respond swiftly to market changes, ultimately driving growth and competitive advantage.
Benefits of Customizable Dashboards for Tailored Data Insights
Customizable dashboards offer a range of detailed benefits for businesses aiming to derive tailored data insights, enhancing their overall efficiency and strategic capabilities.
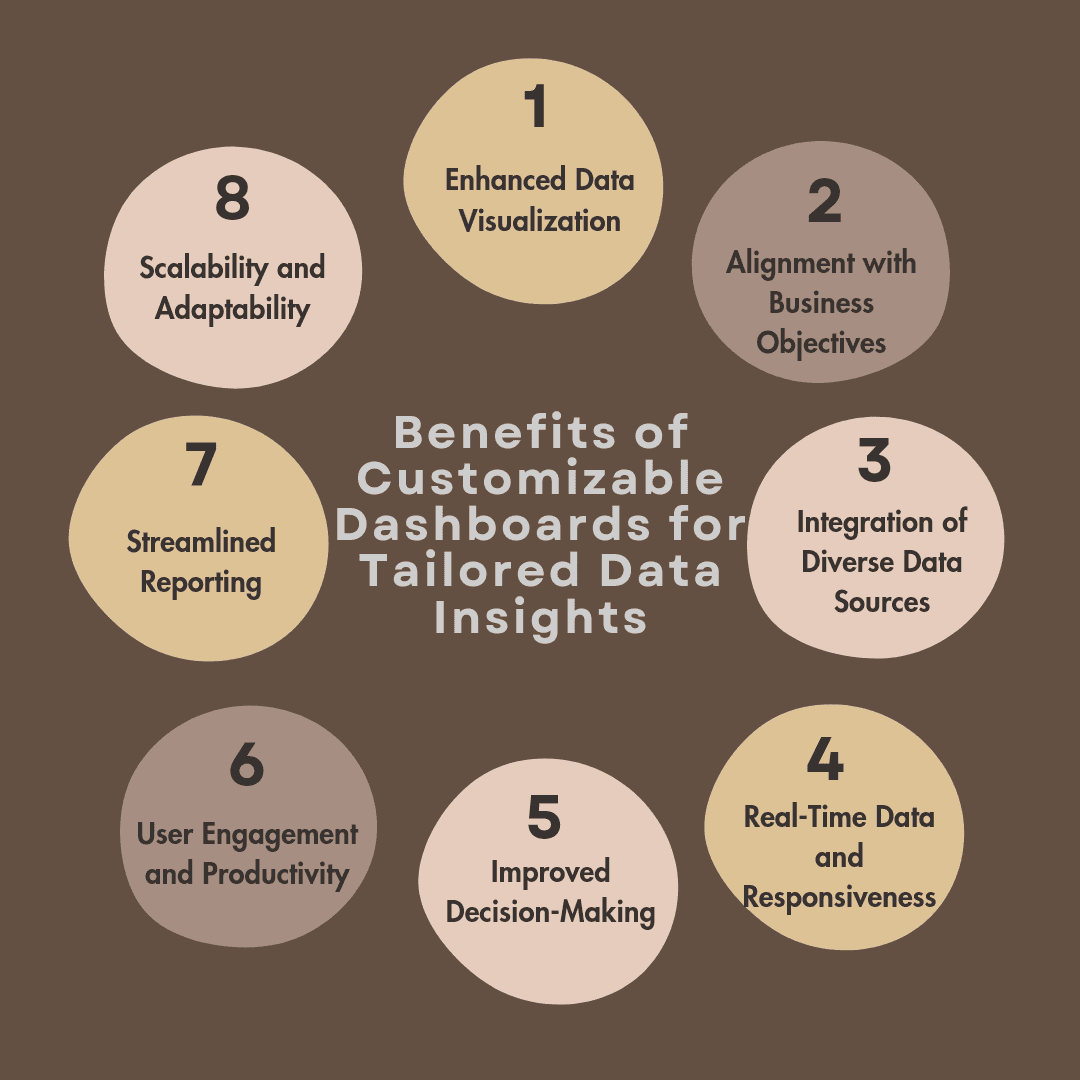
Enhanced Data Visualization: Customizable dashboards allow businesses to visualize data in ways that best suit their specific needs. This flexibility ensures that complex data sets are presented in an intuitive and easily understandable format, helping stakeholders quickly grasp critical insights. By tailoring graphs, charts, and other visual elements, users can focus on the most relevant metrics, making data interpretation faster and more accurate.
Alignment with Business Objectives: These dashboards can be aligned with the unique objectives and goals of different departments or roles within an organization. For instance, a sales team might prioritize real-time sales data and pipeline metrics, while an operations team focuses on supply chain efficiency and inventory levels. This targeted approach ensures that each team has access to the specific data they need to drive performance and achieve their goals.
Integration of Diverse Data Sources: Customizable dashboards can integrate data from multiple sources, such as CRM systems, ERP platforms, social media analytics, and financial databases. This integration breaks down data silos, providing a unified view of the organization’s performance. Having all relevant data in one place simplifies analysis and enhances the accuracy of insights, fostering better-informed decision-making.
Real-Time Data and Responsiveness: The ability to display real-time data is a significant advantage of customizable dashboards. Businesses can monitor ongoing operations and market conditions, allowing for swift responses to new developments. Real-time insights help identify emerging trends, potential issues, and opportunities, enabling proactive rather than reactive management.
Improved Decision-Making: By providing tailored and relevant data, customizable dashboards facilitate better decision-making at all levels of the organization. Executives can use these dashboards to monitor strategic KPIs, while managers can track operational metrics pertinent to their teams. This hierarchical approach ensures that every decision is based on accurate and current data, reducing the risk of errors and improving overall business outcomes.
User Engagement and Productivity: Customizable dashboards are designed with user-friendliness in mind, featuring intuitive interfaces that enhance user engagement. The ease of accessing and analyzing data increases productivity, as users spend less time searching for information and more time deriving actionable insights. Features such as drag-and-drop functionality, customizable widgets, and interactive elements further enhance user experience and efficiency.
Streamlined Reporting: Customizable dashboards simplify the reporting process by providing a centralized platform for data analysis. Users can quickly generate reports that are automatically updated with the latest data, reducing the time and effort required for manual reporting. This capability ensures that stakeholders always have access to the most current information, supporting timely and effective communication within the organization.
Scalability and Adaptability: As businesses grow and evolve, their data needs change. Customizable dashboards offer scalability, allowing organizations to add new data sources, metrics, and visualizations as required. This adaptability ensures that the dashboard remains relevant and valuable, supporting the organization’s long-term data strategy.
Tips for Maximizing the Utility of Dashboards
Customizable dashboards are powerful tools for enhancing business intelligence and decision-making. To fully leverage their potential, businesses should follow these best practices:
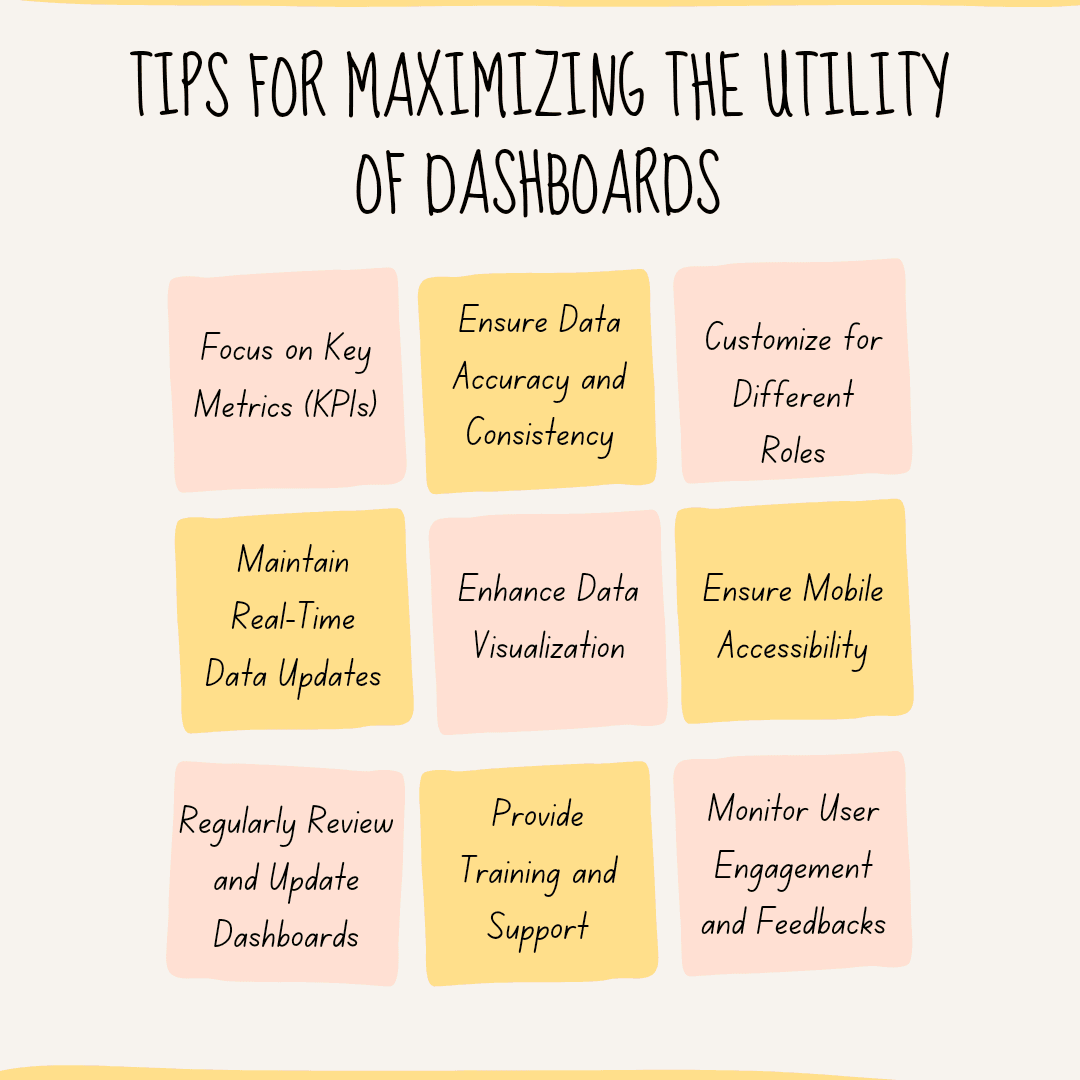
Focus on Key Metrics (KPIs)
Identify Critical KPIs: Determine the most important key performance indicators (KPIs) that align with your business objectives. Focus on metrics that directly impact your strategic goals and decision-making processes.
Prioritize Clarity: Ensure that the dashboard clearly displays these KPIs in a prominent and easily understandable manner. Avoid clutter by limiting the number of metrics displayed to those most relevant to the user’s role.
Ensure Data Accuracy and Consistency
Regular Data Audits: Conduct regular audits to ensure the data feeding into your dashboards is accurate and up-to-date. Inconsistent or incorrect data can lead to misguided decisions.
Standardize Data Sources: Use standardized data sources and formats to ensure consistency across the dashboard. This helps in maintaining data integrity and reliability.
Customize for Different Roles
Role-Based Dashboards: Design dashboards tailored to the specific needs of different roles within the organization. For example, sales teams might need real-time sales figures and customer acquisition metrics, while financial teams might focus on budget performance and cash flow.
User-Specific Views: Allow users to customize their views to focus on the metrics and data points most relevant to their responsibilities. This personalization increases engagement and efficiency.
Maintain Real-Time Data Updates
Automated Data Refresh: Implement automated data refresh cycles to ensure that the dashboard always reflects the most current data. Real-time updates help users make timely and informed decisions.
Monitor Data Latency: Regularly monitor and optimize data latency to ensure minimal delays between data collection and visualization.
Enhance Data Visualization
Effective Use of Visual Elements: Use charts, graphs, and other visual elements to represent data clearly and intuitively. Choose the right type of visualization for each data set to enhance understanding and insight.
Interactive Features: Incorporate interactive features such as drill-down capabilities, filters, and hover-over tooltips. These allow users to explore data in more detail and gain deeper insights.
Ensure Mobile Accessibility
Responsive Design: Ensure that dashboards are designed to be responsive and accessible on various devices, including smartphones and tablets. Mobile accessibility allows users to access crucial data on the go.
Mobile-Friendly Interfaces: Simplify interfaces for mobile devices to ensure ease of use and readability without compromising on the quality and depth of information.
Regularly Review and Update Dashboards
Continuous Improvement: Regularly review the effectiveness of your dashboards and update them based on user feedback and evolving business needs. This continuous improvement ensures that dashboards remain relevant and valuable.
Incorporate New Data Sources: As your business grows, incorporate new data sources and metrics to keep the dashboard aligned with your current operations and goals.
Provide Training and Support
User Training: Offer training sessions to help users understand how to navigate and utilize dashboards effectively. Educated users are more likely to derive meaningful insights and make data-driven decisions.
Ongoing Support: Provide ongoing support to address any issues or questions users might have. A dedicated support team can help maximize the utility of the dashboards.
Monitor User Engagement and Feedback
Usage Analytics: Track how users interact with the dashboards to identify which features are most useful and which might need improvement. Usage analytics can provide valuable insights into user behavior and preferences.
Feedback Loops: Establish feedback mechanisms where users can suggest improvements or report issues. Actively incorporating user feedback helps in refining and enhancing the dashboard over time.
By following these best practices, businesses can maximize the utility of their customizable dashboards, ensuring they deliver actionable insights, drive informed decisions, and ultimately contribute to the organization’s success.
How Analytics Safe Helps
Facing the discontinuation of Google Analytics 3 (GA3) can be a daunting challenge for many businesses. Analytics Safe offers a seamless solution to bridge this gap, ensuring that no historical data is lost while enhancing your data-driven decision-making capabilities. By integrating your existing GA3 data with Google Analytics 4 (GA4), Analytics Safe maximizes the utility of your customizable dashboards in several key ways:
Real-Time Data Syncing- Analytics Safe keeps your data up-to-date with real-time syncing. This ensures that your dashboards reflect the most current information, enabling timely insights and decisions. With real-time data, businesses can quickly respond to market changes, track ongoing campaigns, and monitor performance metrics without delay.
Advanced Compliance and Security- Analytics Safe maintains the highest standards of data security, safeguarding your information throughout the migration process. This robust security framework ensures that your data remains protected from breaches and unauthorized access, preserving the integrity and reliability of your dashboards. Businesses can trust that their sensitive information is secure, enabling them to focus on deriving insights rather than worrying about data protection.
Customizable Analytics Reports- Analytics Safe allows you to design and tailor reports to meet the unique needs of your business. Customizable views and metrics enable you to focus on the most relevant data, enhancing the clarity and utility of your dashboards. Whether you need detailed reports for in-depth analysis or high-level summaries for quick decision-making, Analytics Safe's flexible reporting capabilities ensure that your dashboards provide the exact insights required by different stakeholders.
Seamless Integration of Historical Data- By integrating GA3 data with GA4, Analytics Safe ensures that no historical data is lost. This seamless integration allows businesses to retain valuable historical insights while transitioning to a more advanced analytics platform. The continuity of data ensures that long-term trends and patterns remain accessible, providing a comprehensive view of business performance over time.
Conclusion
In an era where data-driven decision-making is paramount, customizable dashboards have emerged as essential tools for businesses aiming to maximize their data utility. By offering enhanced data visualization, alignment with business objectives, integration of diverse data sources, real-time responsiveness, and tailored insights, these dashboards empower organizations to operate more efficiently and strategically. Analytics Safe further augments the utility of these dashboards by ensuring seamless data migration from Google Analytics 3 to Google Analytics 4, providing real-time data syncing, advanced security, customizable reports, and preserving historical data. These features collectively enhance the accuracy, security, and relevance of business intelligence, driving informed decisions and sustained growth.
Take your data strategy to the next level with Analytics Safe. Contact us today to learn more about how we can help you maximize the utility of your customizable dashboards and ensure a seamless transition to Google Analytics 4.
